
Examination of Computational Performance and Potential Applications of a Global Numerical Weather Prediction Model MPAS Using KISTI Supercomputer NURION


Abstract
:1. Introduction
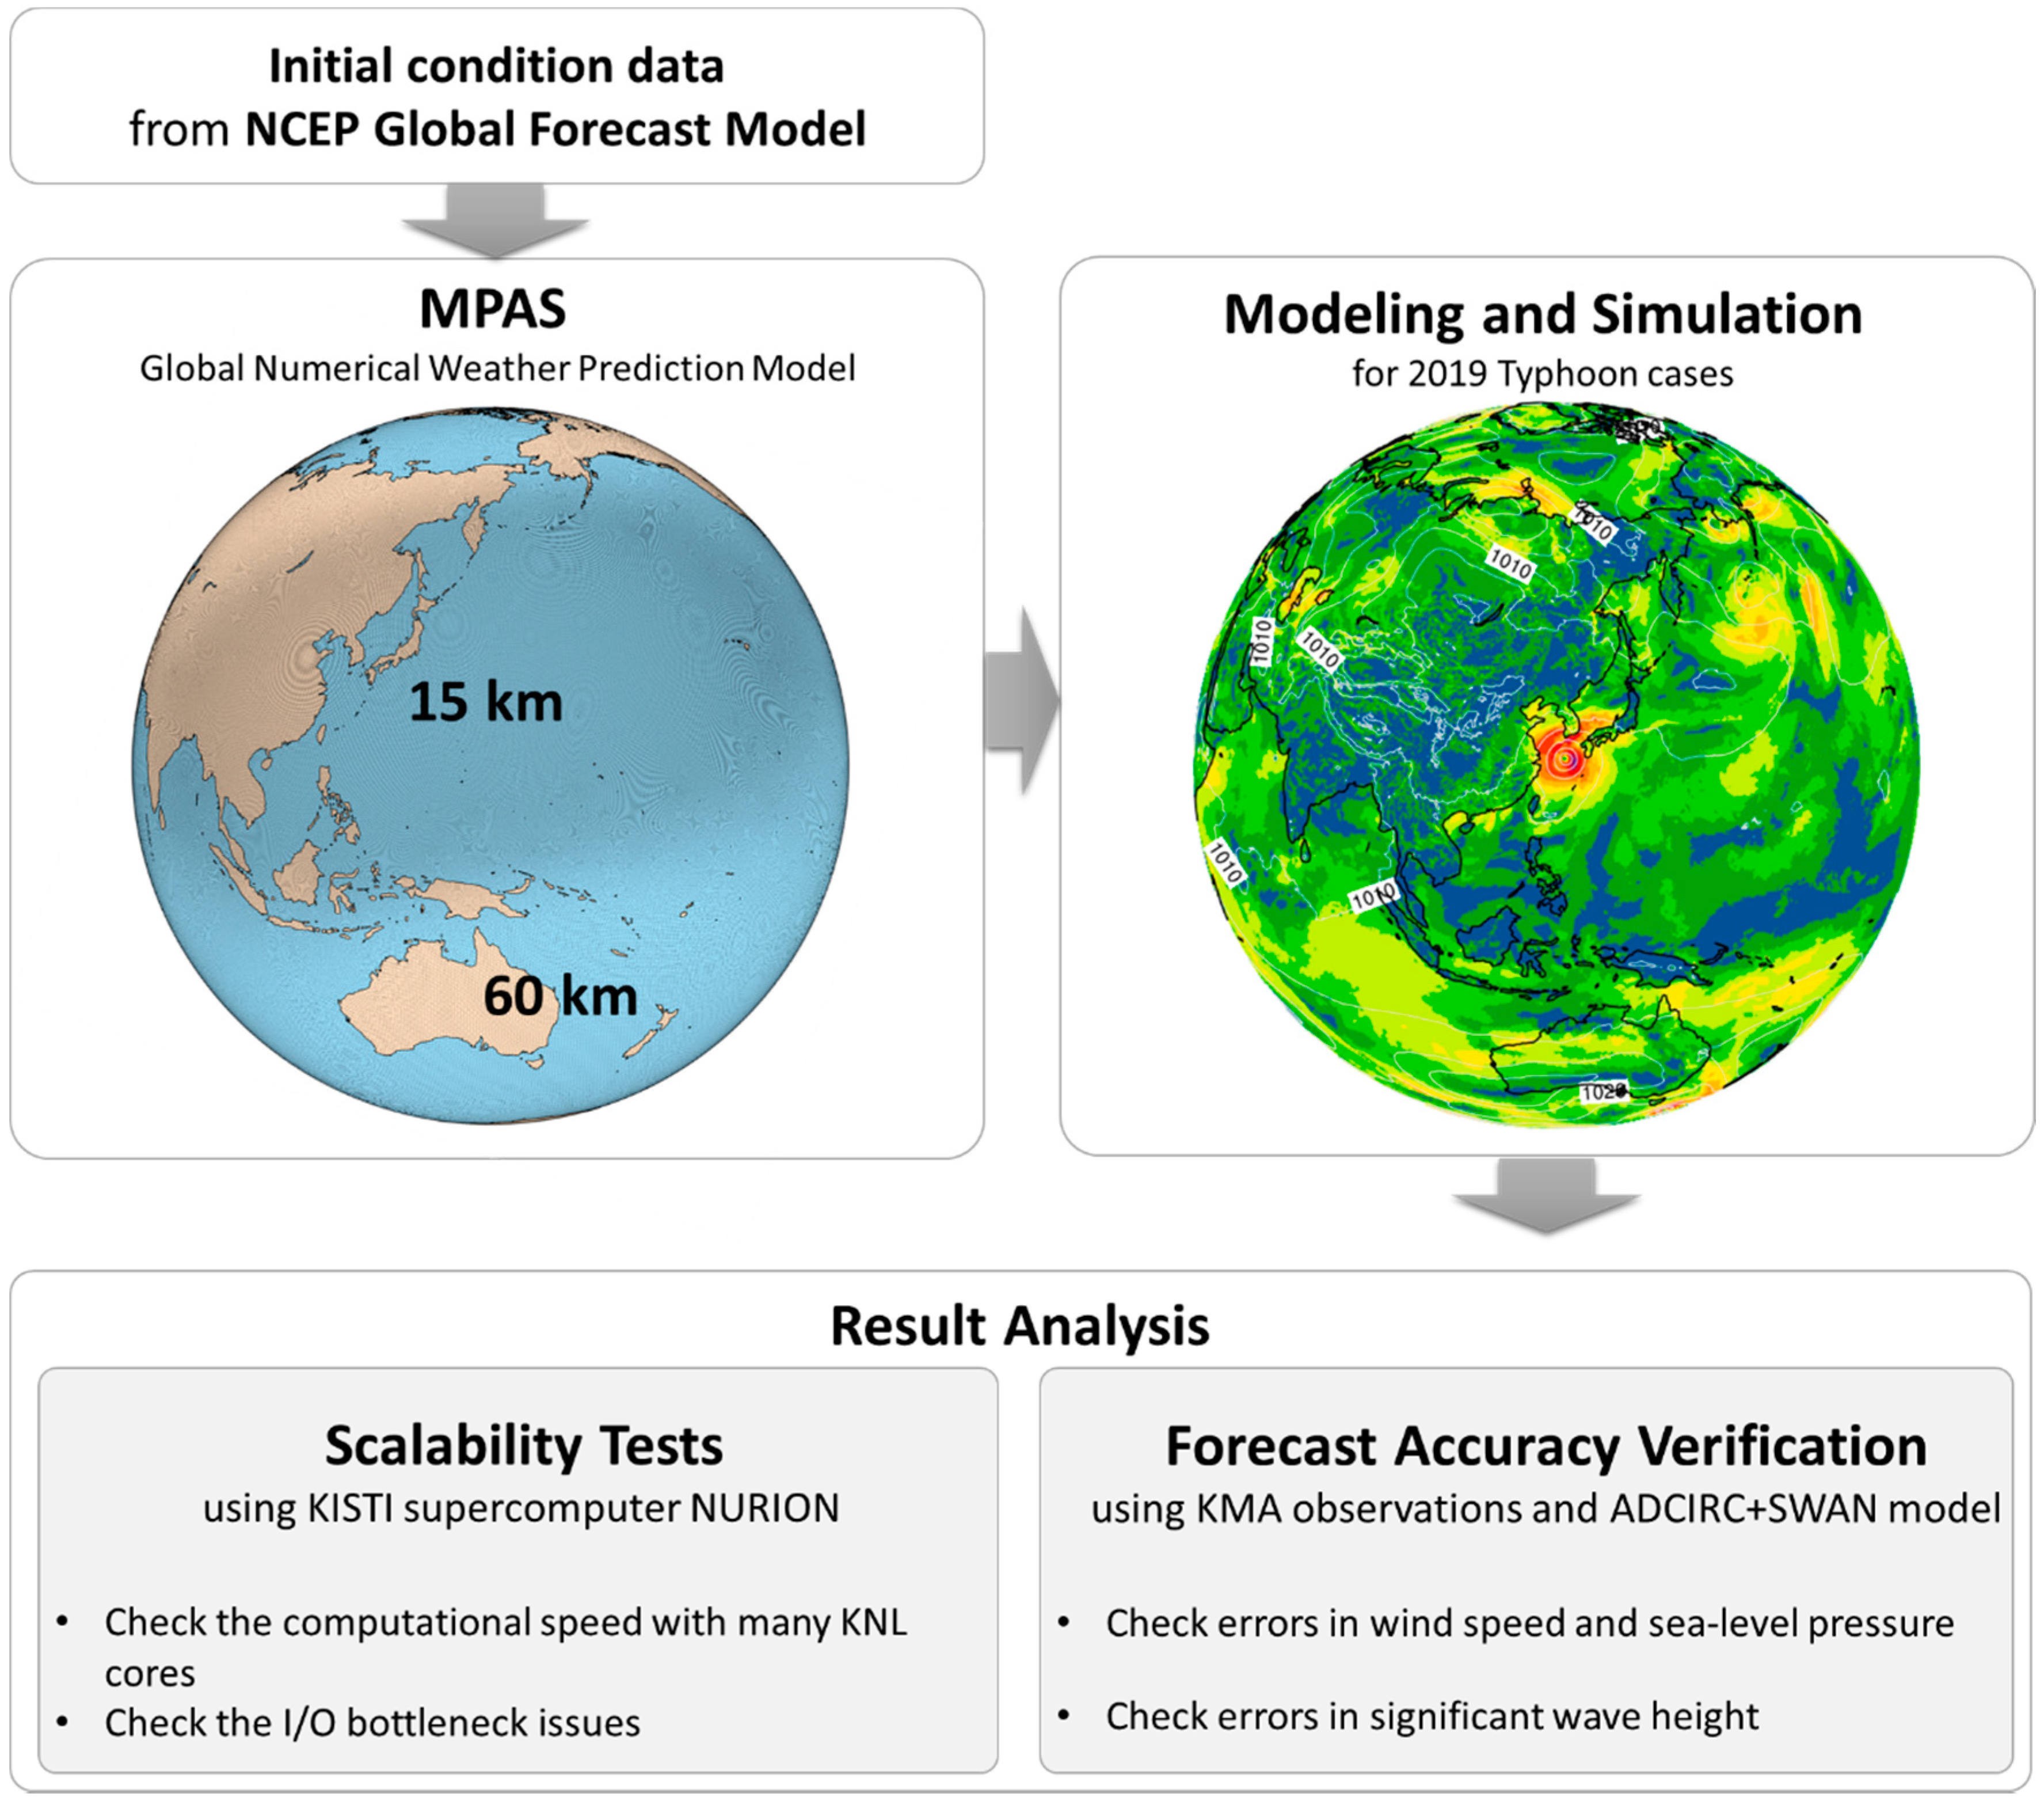
2. Methodology
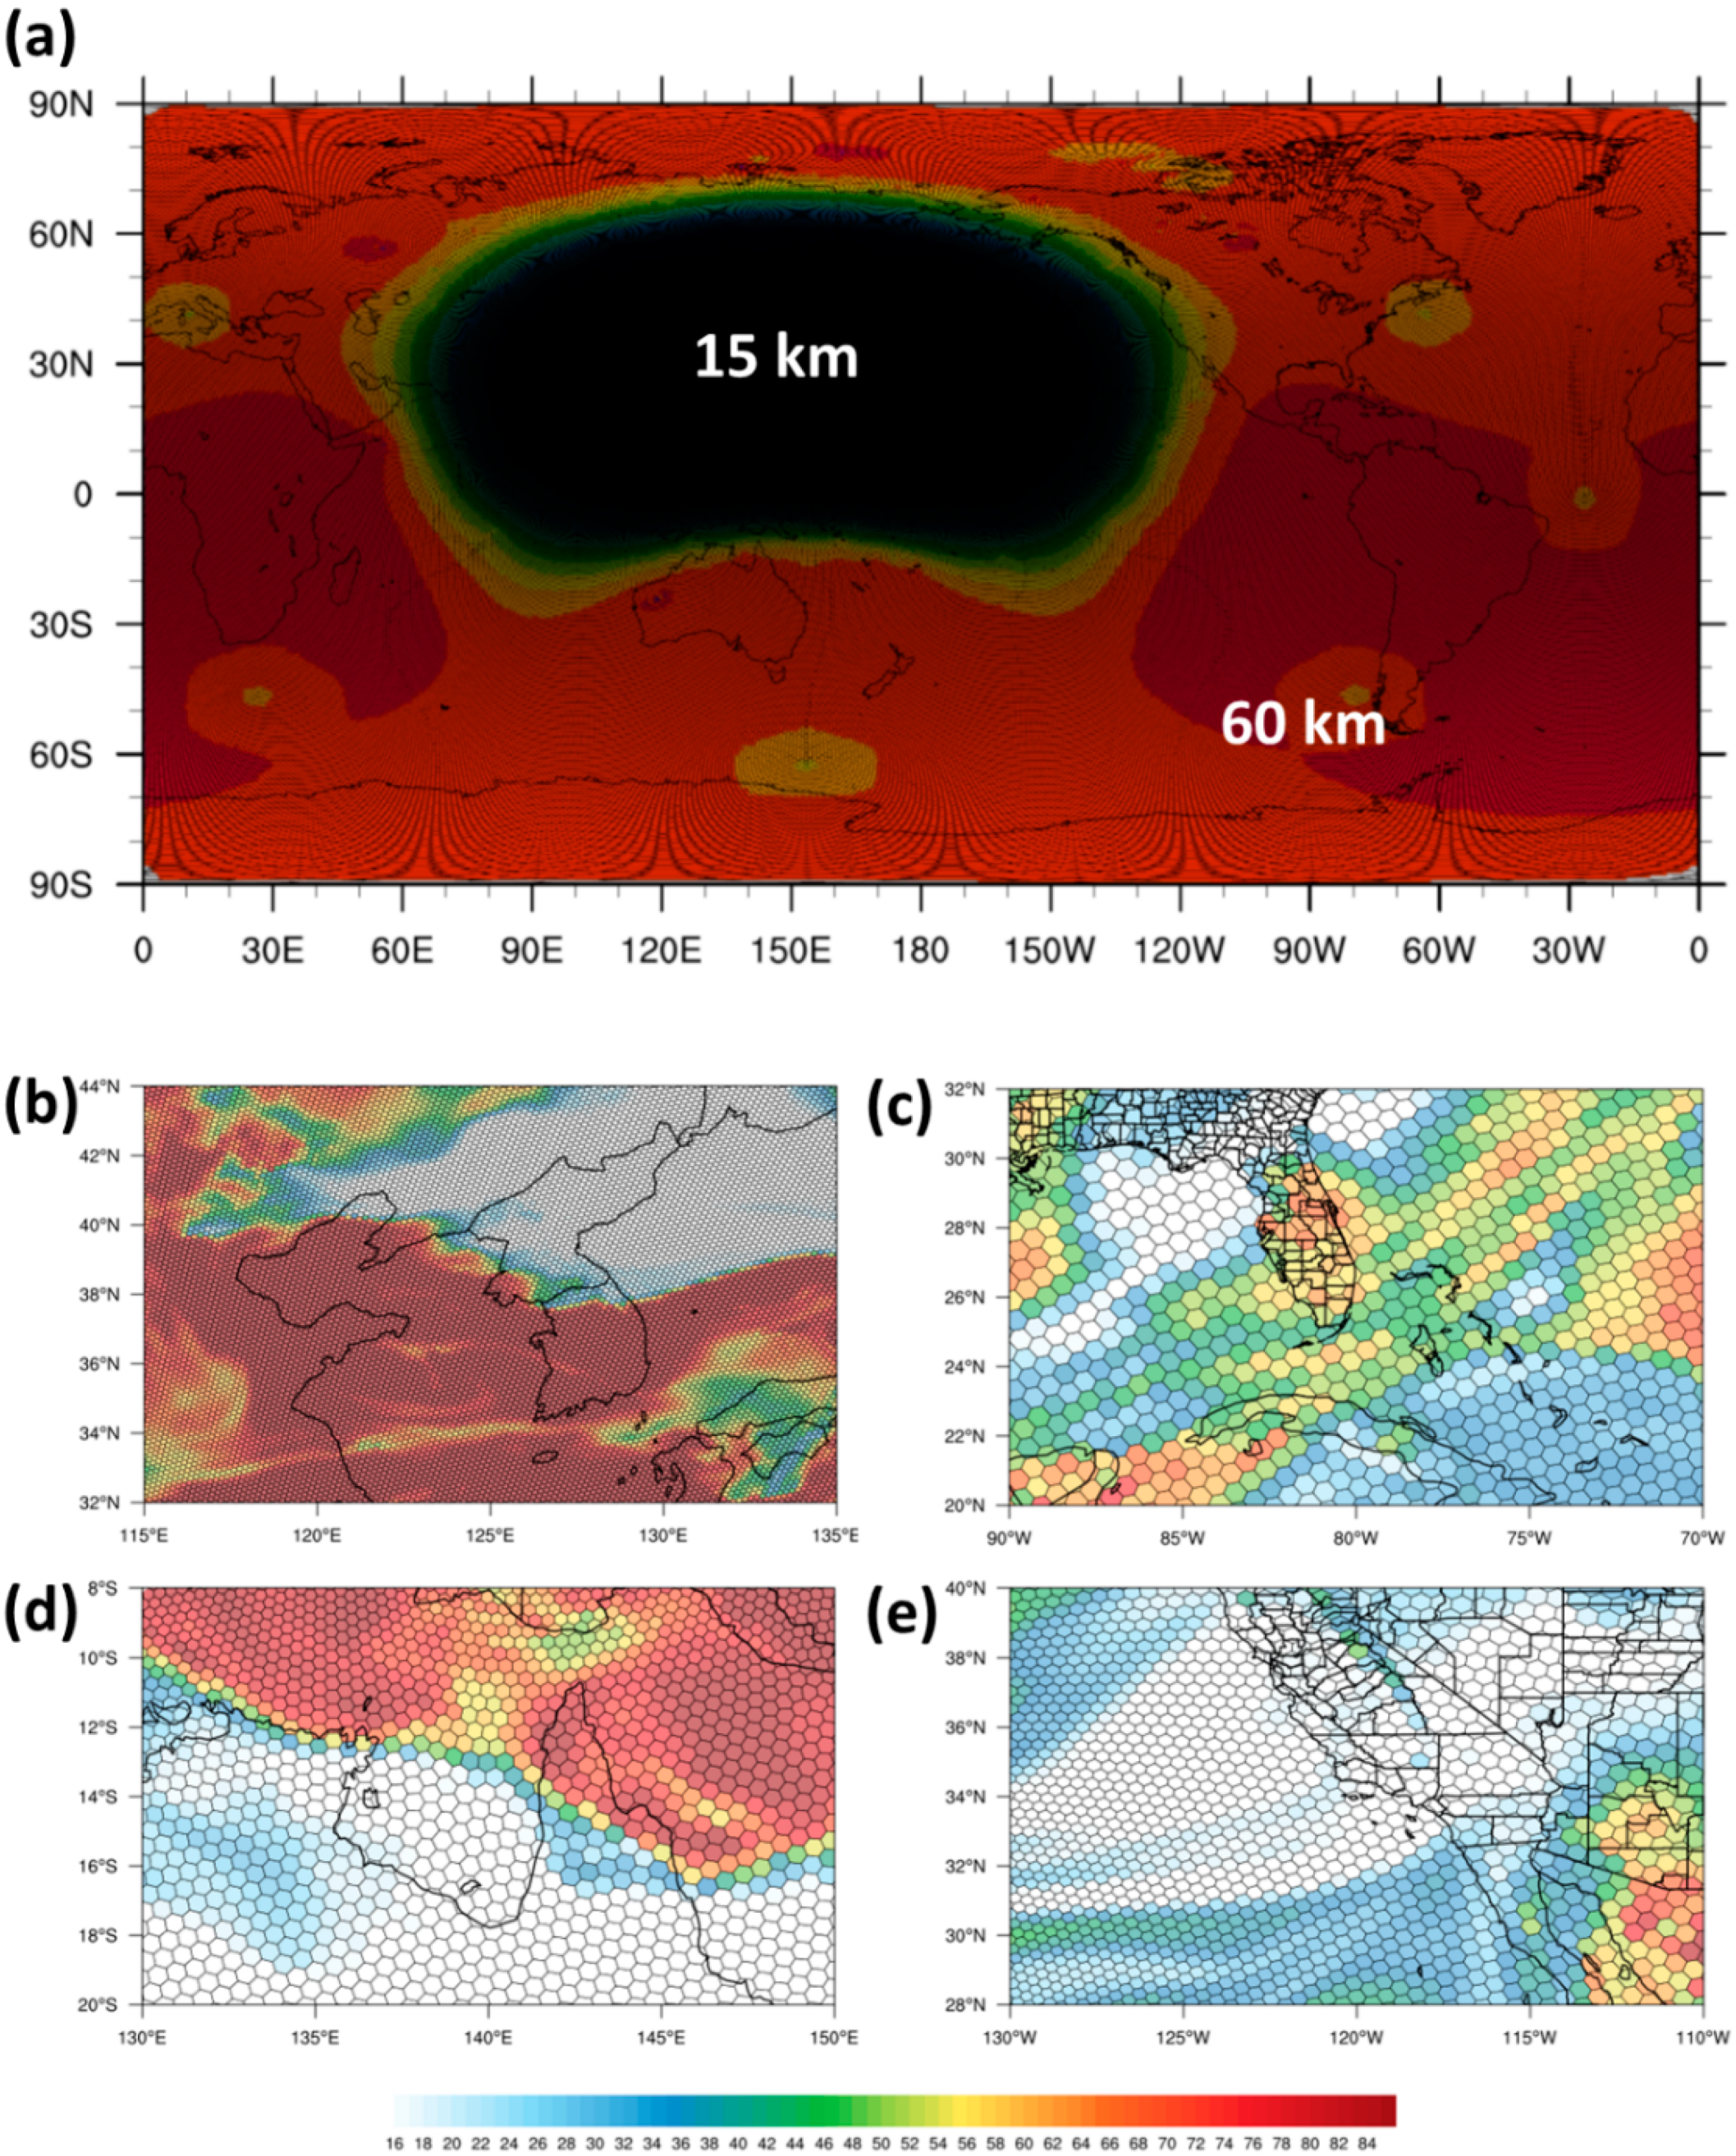
2.1. MPAS Model
2.2. Scalability Tests of MPAS on NURION
2.3. Potential Application of MPAS to Coastal Flooding
3. Results
3.1. Scalability Tests
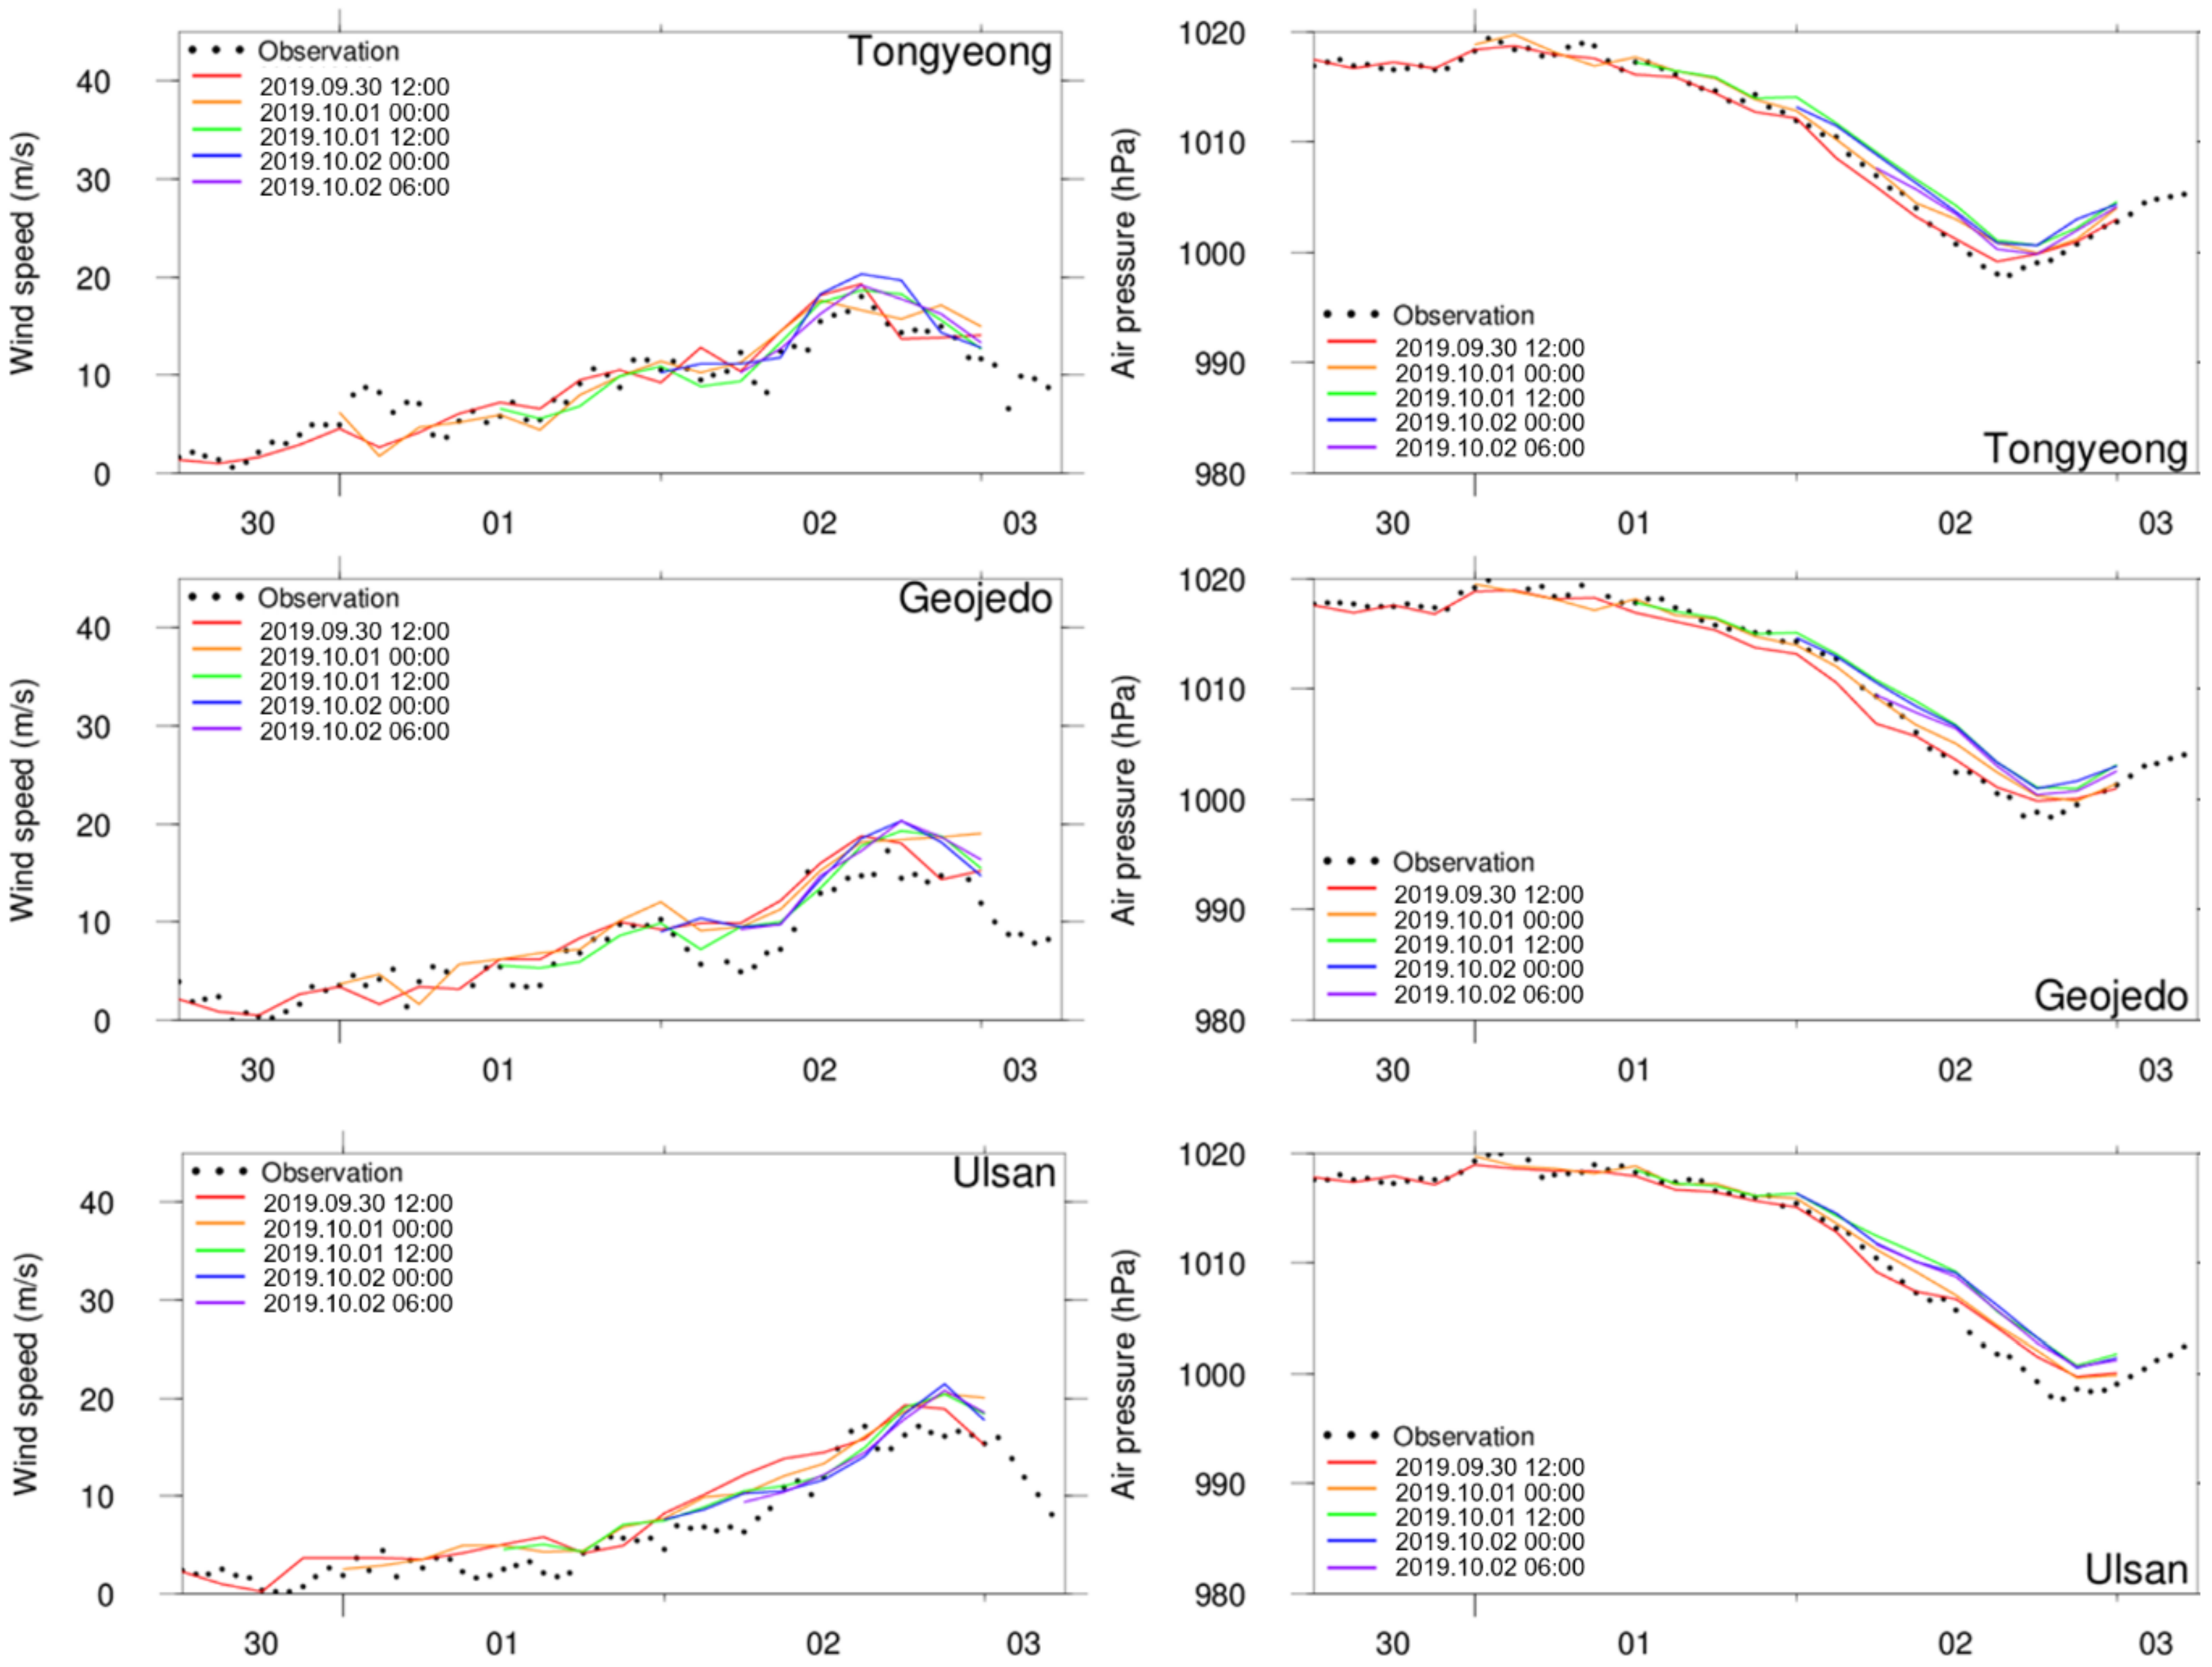
3.2. Potential Application of MPAS to Coastal Flooding
4. Summary and Discussion
Author Contributions
Funding
Institutional Review Board Statement
Informed Consent Statement
Data Availability Statement
Acknowledgments
Conflicts of Interest
References
- National Academies of Sciences, Engineering, and Medicine. Attribution of Extreme Weather Events in the Context of Climate Change, 1st ed.; National Academies Press: Washington, DC, USA, 2016. [Google Scholar]
- Mann, M.E.; Rahmstorf, S.; Kornhuber, K.; Steinman, B.A.; Miller, S.K.; Coumou, D. Influence of anthropogenic climate change on planetary wave resonance and extreme weather events. Sci. Rep. 2017, 7, 45242. [Google Scholar] [CrossRef] [PubMed] [Green Version]
- Vitart, F.; Robertson, A.W. Introduction: Why Sub-seasonal to Seasonal Prediction (S2S)? In Sub-Seasonal to Seasonal Prediction, 1st ed.; Robertson, A.W., Vitart, F., Eds.; Elsevier: Amsterdam, The Netherlands, 2019; pp. 3–15. [Google Scholar] [CrossRef]
- Jackson, P.F. Book Review: Scientific Applications of Multiprocessors. Int. J. Electr. Eng. Educ. 1990, 27, 90. [Google Scholar] [CrossRef]
- Davies, A. Book Review: Computing for Scientists and Engineers: A workbook of analysis, numerics and applications. Int. J. Electr. Eng. Educ. 1994, 31, 91–92. [Google Scholar] [CrossRef]
- Skamarock, W.C.; Klemp, J.B.; Duda, M.G.; Fowler, L.D.; Park, S.H.; Ringler, T.D. A multiscale nonhydrostatic atmospheric model using centroidal Voronoi tesselations and C-grid staggering. Mon. Weather Rev. 2012, 140, 3090–3105. [Google Scholar] [CrossRef] [Green Version]
- Sinkovits, R.S.; Duda, M.G. Optimization and parallel load balancing of the MPAS Atmosphere Weather and Climate Code. In Proceedings of the XSEDE16 Conference on Diversity, Big Data, and Science at Scale, Miami, FL, USA, 17–21 July 2016; Article No.: 5. Association for Computing Machinery: New York, NY, USA, 2016; pp. 1–6. [Google Scholar] [CrossRef]
- Yang, C.; Xue, W.; Fu, H.; You, H.; Wang, X.; Ao, Y.; Liu, F.; Gan, L.; Xu, P.; Wang, L.; et al. 10M-core Scalable Fully-Implicit Solver for Nonhydrostatic Atmospheric Dynamics. In Proceedings of the SC’16 International Conference for High Performance Computing, Networking, Storage and Analysis, Salt Lake City, UT, USA, 13–18 November 2016; Devine, K., Ed.; Institute of Electrical and Electronics Engineers: Danvers, MA, USA, 2016; pp. 57–68. [Google Scholar] [CrossRef]
- Park, S.-H.; Klamp, J.B.; Skamarock, W.C. A comparison of mesh refinement in the global MPAS-A and WRF models using an idealized normal-mode baroclinic wave simulation. Mon. Weather Rev. 2014, 142, 3614–3634. [Google Scholar] [CrossRef]
- Skamarock, W.C.; Klemp, J.B.; Dudhia, J.; Gill, D.O.; Barker, D.; Duda, M.G.; Huang, X.-Y.; Wang, W.; Powers, J.G. A Description of the Advanced Research WRF Version 3; No. NCAR/TN-475+STR; University Corporation for Atmospheric Research: Boulder, CO, USA, 2019. [Google Scholar] [CrossRef]
- NCEP GDAS/FNL 0.25 Degree Global Tropospheric Analyses and Forecast Grids; National Centers for Environmental Prediction/National Weather Service/NOAA/U.S. Department of Commerce: Boulder, CO, USA, 2015. [CrossRef]
- Strohmaier, E.; Meuer, H.W.; Dongarra, J.; Simon, H.D. The TOP500 List and Progress in High-Performance Computing. Computer 2015, 48, 42–49. [Google Scholar] [CrossRef] [Green Version]
- Specifying the Number of Nodes and Processes. Available online: https://acg.maine.edu/training-support/hpc/running-a-program/specifying-the-number-of-nodes-and-processes/ (accessed on 25 September 2020).
- Dietrich, J.C.; Zijlema, M.; Westerink, J.J.; Holthuijsen, L.H.; Dawson, C.; Luettich, R.A., Jr.; Jensen, R.E.; Smith, J.M.; Stelling, G.S.; Stone, G.W.. Modeling hurricane waves and storm surge using integrally-coupled, scalable computations. Coast. Eng. 2011, 58, 45–65. [Google Scholar] [CrossRef]
- Luettich, R.A.; Westerink, J.J.; Scheffner, N.W. ADCIRC: An Advanced Three-Dimensional Circulation Model for Shelves, Coasts, and Estuaries. Report 1, Theory and Methodology of ADCIRC-2DD1 and ADCIRC-3DL; No. WES/TR/DRP-92-6-1; Coastal Engineering Research Center: Vicksburg, MI, USA, 19 November 1992. [Google Scholar]
- Westerink, J.J.; Luettich, R.A., Jr.; Blain, C.A.; Scheffner, N.W. Adcirc: An Advanced Three-Dimensional Circulation Model for Shelves, Coasts, and Estuaries. Report 2. User’s Manual for Adcirc-2ddi; No. WES/TR/DRP-92-6-2; Coastal Engineering Research Center: Vicksburg, MI, USA, 19 November 1992. [Google Scholar]
- Booij, N.R.R.C.; Ris, R.C.; Holthuijsen, L.H. A third-generation wave model for coastal regions: 1. Model description and validation. J. Geophys. Res. Ocean. 1999, 104, 7649–7666. [Google Scholar] [CrossRef] [Green Version]
- Ris, R.C.; Holthuijsen, L.H.; Booij, N. A third-generation wave model for coastal regions: 2. Verification. J. Geophys. Res. Ocean. 1999, 104, 7667–7681. [Google Scholar] [CrossRef]
- Yuk, J.H.; Kim, K.O.; Choi, B.H. The simulation of a storm surge and wave due to typhoon Sarah using an integrally coupled tide-surge-wave model of the Yellow and East China Seas. Ocean. Sci. J. 2015, 50, 683–699. [Google Scholar] [CrossRef]
- Luu, H.; Behzad, B.; Aydt, R.; Winslett, M. A multi-level approach for understanding I/O activity in HPC applications. In 2013 IEEE International Conference on Cluster Computing (CLUSTER); IEEE: Indinanapolis, IN, USA, 27 September 2013; pp. 1–5. [Google Scholar] [CrossRef]
- Harrington, P. Diagnosing parallel I/O bottlenecks in HPC applications. In Proceedings of the International Conference for High Performance Computing Networking Storage and Analysis (SCI7), Denver, CO USA, 12–17 November 2017; Association for Computing Machinery: New York, NY, USA, 2017. [Google Scholar]
- Liu, J.; Koziol, Q.; Tang, H.; Tessier, F.; Bhimji, W.; Cook, B.; Austin, B.; Byna, S.; Thakur, B.; Lockwood, G.; et al. Understanding the I/O Performance Gap Between Cori KNL and Haswell. Presented at the CUG 2017, Redmond, WA, USA, 6–12 May 2017; pp. 1–8. [Google Scholar]
- Karthick, S.; Malathi, D. A performance evaluation of hybrid genetic algorithm approach for forecasting tropical cyclone categories. Int. J. Electr. Eng. Educ. 2020, 1–15. [Google Scholar]
- Lin, G.F.; Chou, Y.C.; Wu, M.C. Typhoon flood forecasting using integrated two-stage support vector machine approach. J. Hydrol. 2013, 486, 334–342. [Google Scholar] [CrossRef]
- Kim, S.; Kang, J.-S.; Lee, M.; Song, S.-K. DeepTC: ConvLSTM Network for Trajectory Prediction of Tropical Cyclone Using Spatiotemporal Atmospheric Simulation Data. 2018. Available online: https://openreview.net/forum?id=HJlCVoPAF7 (accessed on 7 October 2021).


| Parameterization | Schemes |
|---|---|
| Microphysics | WSM6 |
| Convection | New Tiedtke |
| Radiation (long/short waves) | RRTMG |
| Cloud fraction for radiation | Xu–Randall |
| Gravity wave drag by orography | YSU |
| Boundary layer | YSU |
| Surface layer | Monin–Obukhov |
| Land surface | NOAH |
| Typhoon | Target Period | Initial Time of MPAS | End Time of MPAS |
|---|---|---|---|
| Lingling | 06 UTC on Sep. 7– 18 UTC on Sep. 8 | 06 UTC on Sep. 5 | 18 UTC on Sep. 8 |
| 18 UTC on Sep. 5 | |||
| 06 UTC on Sep. 6 | |||
| 18 UTC on Sep. 6 | |||
| 00 UTC on Sep. 7 | |||
| Tapah | 12 UTC on Sep. 22– 00 UTC on Sep. 23 | 12 UTC on Sep. 20 | 00 UTC on Sep. 23 |
| 00 UTC on Sep. 21 | |||
| 12 UTC on Sep. 21 | |||
| 00 UTC on Sep. 22 | |||
| 06 UTC on Sep. 22 | |||
| Mitag | 12 UTC on Oct. 2– 00 UTC on Oct. 3 | 12 UTC on Sep. 30 | 00 UTC on Oct. 3 |
| 00 UTC on Oct. 1 | |||
| 12 UTC on Oct. 1 | |||
| 00 UTC on Oct. 2 | |||
| 06 UTC on Oct. 2 |
| # Cores | 512 | 1024 | 2048 | |
|---|---|---|---|---|
| I/O Strategy | ||||
| Lustre-Stripe 4 (default) | 144.05 | 231.28 | 576.85 | |
| Lustre-Stripe 16 | 142.52 | 225.82 | 582.73 | |
| Burst Buffer | 137.71 | 224.62 | 586.03 | |
| Forecast Hour | Absolute Error | Number of Samples |
|---|---|---|
| 6 | 15.94 | 86 |
| 12 | 19.16 | 87 |
| 18 | 15.59 | 86 |
| 24 | 15.10 | 89 |
| 30 | 15.30 | 84 |
| 36 | 23.14 | 87 |
Publisher’s Note: MDPI stays neutral with regard to jurisdictional claims in published maps and institutional affiliations. |
© 2021 by the authors. Licensee MDPI, Basel, Switzerland. This article is an open access article distributed under the terms and conditions of the Creative Commons Attribution (CC BY) license (https://creativecommons.org/licenses/by/4.0/).
Share and Cite
Kang, J.-S.; Myung, H.; Yuk, J.-H. Examination of Computational Performance and Potential Applications of a Global Numerical Weather Prediction Model MPAS Using KISTI Supercomputer NURION. J. Mar. Sci. Eng. 2021, 9, 1147. https://doi.org/10.3390/jmse9101147
Kang J-S, Myung H, Yuk J-H. Examination of Computational Performance and Potential Applications of a Global Numerical Weather Prediction Model MPAS Using KISTI Supercomputer NURION. Journal of Marine Science and Engineering. 2021; 9(10):1147. https://doi.org/10.3390/jmse9101147
Chicago/Turabian StyleKang, Ji-Sun, Hunjoo Myung, and Jin-Hee Yuk. 2021. "Examination of Computational Performance and Potential Applications of a Global Numerical Weather Prediction Model MPAS Using KISTI Supercomputer NURION" Journal of Marine Science and Engineering 9, no. 10: 1147. https://doi.org/10.3390/jmse9101147